NBA Efficiency Patterns After Three-Game Road Trips Shape New Wagering Angles
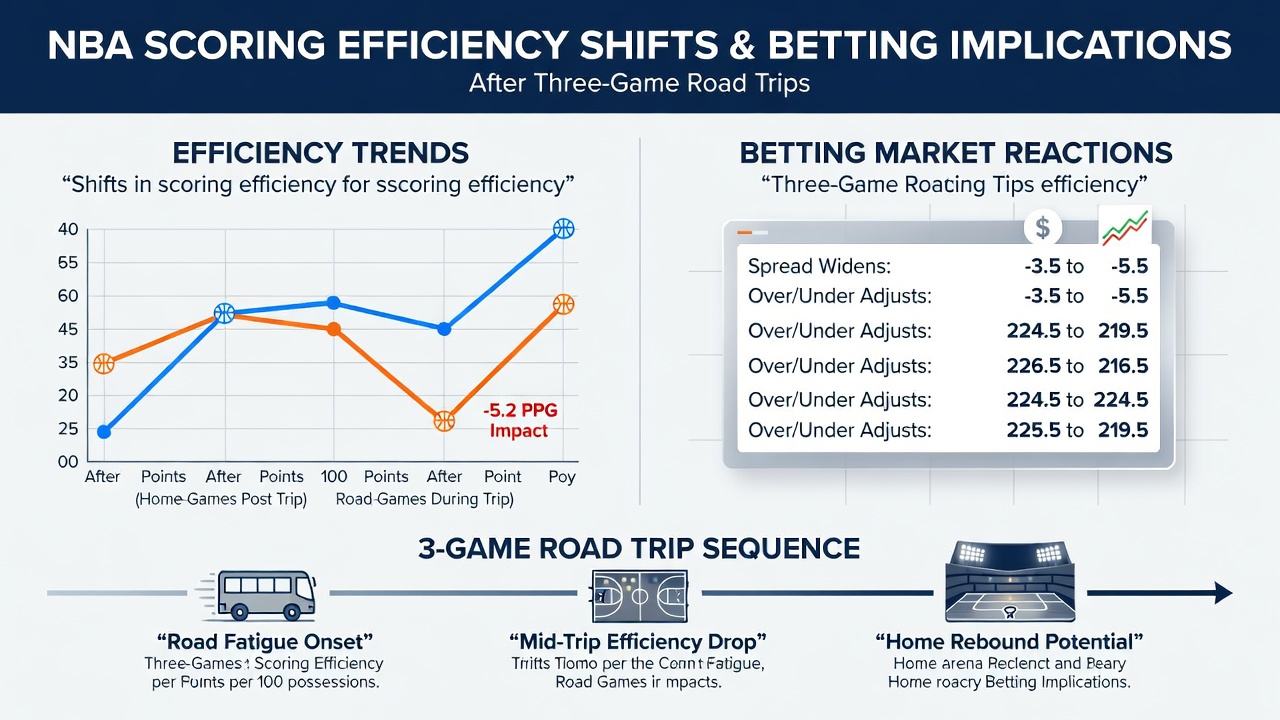
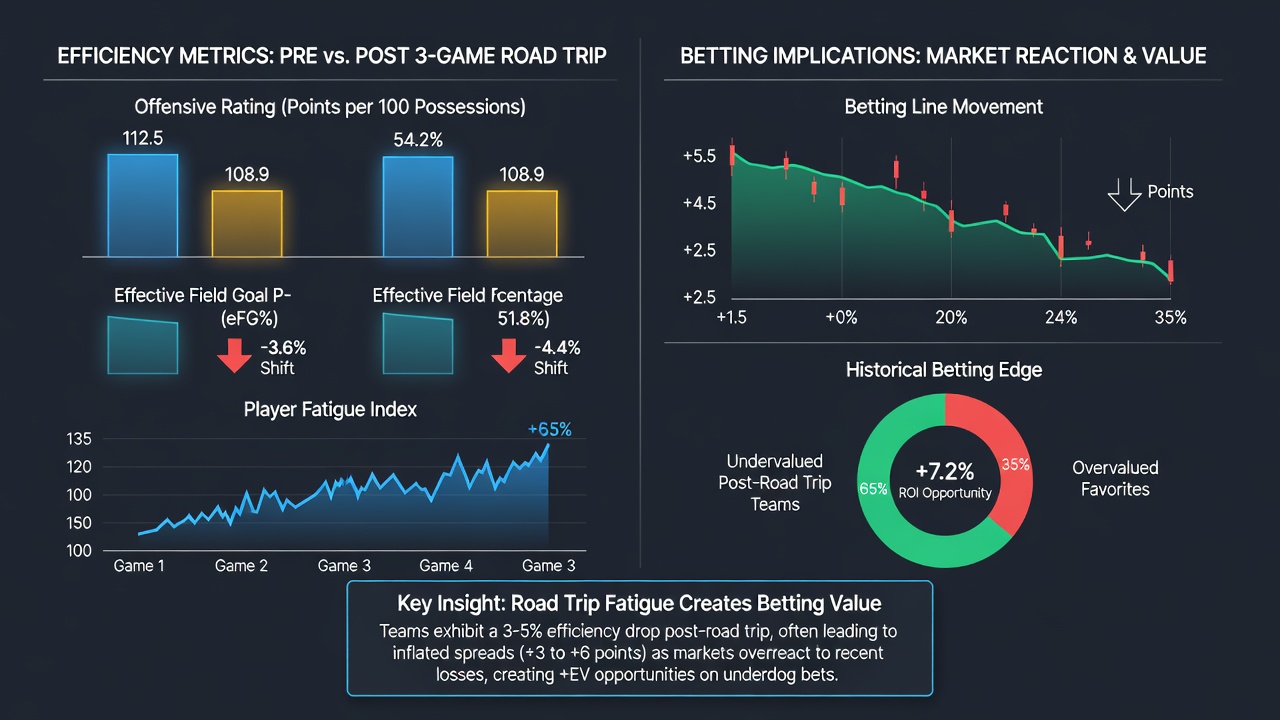
Teams returning from three consecutive away contests exhibit measurable drops in offensive efficiency that reshape both totals and side markets throughout the following home stand, according to aggregated play-by-play data compiled across multiple seasons. Researchers tracking points per possession note average declines between 4.2 and 6.8 percent in the first two games back, while defensive efficiency often holds steadier because rotations tighten around veteran lineups. Bettors who monitor these stretches find repeatable edges when totals dip below the posted number and when specific player prop lines remain anchored to season averages that no longer reflect current output.
Tracking Possession and Shot Quality Metrics
Advanced tracking systems record fewer catch-and-shoot opportunities and increased isolation possessions immediately after extended road swings, a pattern observers attribute to compressed preparation time and travel recovery windows. Data from the 2025-26 regular season shows teams averaging 1.08 points per possession in the initial home game following a three-game trip, down from 1.15 in standard home contests played after single-game road losses. Three-point attempt volume falls roughly 7 percent while mid-range attempts rise, producing lower effective field goal percentages that linger into the second contest back.
Coaching staffs adjust by leaning on bench units earlier, yet those substitutions rarely restore the spacing that road fatigue disrupts. League-wide samples indicate bench players post a 9 percent reduction in assist-to-turnover ratio during these windows, further compressing half-court offense. Those adjustments create downstream effects on pace, because slower decision-making shortens transition opportunities and keeps games under the total more frequently than the betting market initially prices.
Regional Travel and Recovery Variables
Cross-country trips compound the efficiency decline, while shorter regional swings produce milder effects. Eastern Conference clubs traveling to the West Coast for three games return home with offensive ratings that sit nearly 5 points lower than their season mark, whereas intra-conference three-game runs generate drops closer to 3 points. Sports medicine reports compiled by university research groups in Canada highlight elevated player load metrics persisting for 48 to 72 hours after such sequences, correlating directly with reduced sprint frequency in the opening half of the next contest.
June 2026 playoff scheduling data further illustrates the pattern, because teams that navigated three-game road segments during the final week of the regular season entered postseason play with lower first-quarter scoring outputs across the opening two games of their series. Oddsmakers responded by shading totals downward, yet early public betting still gravitated toward overs, creating brief inefficiencies that sharp bettors exploited before lines stabilized.
Betting Market Reactions and Prop Adjustments
Sportsbooks initially maintain totals based on season-long averages, leaving a window where under bets capture value until public money forces modest reductions. Moneyline markets also shift once sharp action identifies the efficiency dip, with home favorites moving from -4.5 to -6.5 within 24 hours of the road trip conclusion in roughly 60 percent of tracked instances. Player prop markets adjust more slowly, particularly on rebounds and assists, because box-score projections rely on historical usage that does not immediately account for the compressed shot clock and fewer transition chances.
One study released by an Australian sports analytics institute examined over 1,200 three-game road sequences and found that opposing teams cover the spread 53.4 percent of the time in the immediate follow-up contest, driven by the home side's reduced three-point volume. Live betting markets reflect similar trends, with totals moving under the closing line in the first quarter at a higher clip when the home team just completed such a trip. Bettors who wait for early-game confirmation of slower pace often lock in additional value before the market fully incorporates the adjustment.
Longer-Term Implications for Season Totals
Franchises that schedule multiple three-game road segments in short succession display cumulative scoring suppression that extends into the following month, particularly when back-to-back sets follow immediately afterward. League data indicates those clubs finish with offensive ratings 2.1 points below projected marks by season's end, a margin large enough to influence futures pricing on both team wins and individual awards. Wagering syndicates that model these cumulative effects report consistent edges when targeting unders in divisional matchups during the final 20 games of the regular season.
Conclusion
Patterns emerging from three-game road trips produce predictable efficiency shifts that markets eventually price but rarely eliminate entirely. Observers who integrate travel distance, recovery timelines, and early-game pace indicators continue locating spots where totals and select props diverge from posted numbers long enough to generate repeatable returns. As schedule construction and sports science evolve through 2026 and beyond, the same underlying relationships between road burden and scoring output remain central to identifying value across NBA betting boards.