West Coast Road Grinds: Documented Effects of Travel Fatigue on NBA Point Spreads and Game Totals
West Coast road trips in the NBA create measurable shifts in team performance that directly influence betting markets for spreads and totals, with data from the 2025-26 regular season and early playoff rounds illustrating consistent patterns across multiple clubs. Teams crossing two or three time zones eastward to westward often face compressed recovery windows, and analysts tracking box scores have noted corresponding dips in shooting efficiency and defensive rebound rates during the second and third games of such swings. These adjustments appear in aggregated league data rather than isolated anecdotes, as back-to-back contests on the Pacific coast compound sleep disruption and travel stress for Eastern and Central division squads.
Travel Patterns and Schedule Density in the 2025-26 Season
League schedules place several clubs on extended Western swings each spring, and May 2026 featured at least four Eastern Conference teams completing five-game road trips that included stops in Los Angeles, Sacramento, and Portland. Scheduling databases show these sequences typically span nine to eleven days, with limited days off between contests and long flights separating venues. Researchers examining performance metrics across similar stretches in prior seasons found average point differentials narrowing by 3.2 points when the visiting side arrived after crossing multiple zones, while totals trended 4.1 points below season averages in the middle games of those trips. Observers note that these movements align with documented circadian rhythm studies rather than random variance, because teams returning eastward after such grinds post recovery numbers closer to baseline within forty-eight hours.
Statistical Shifts in Spreads and Totals
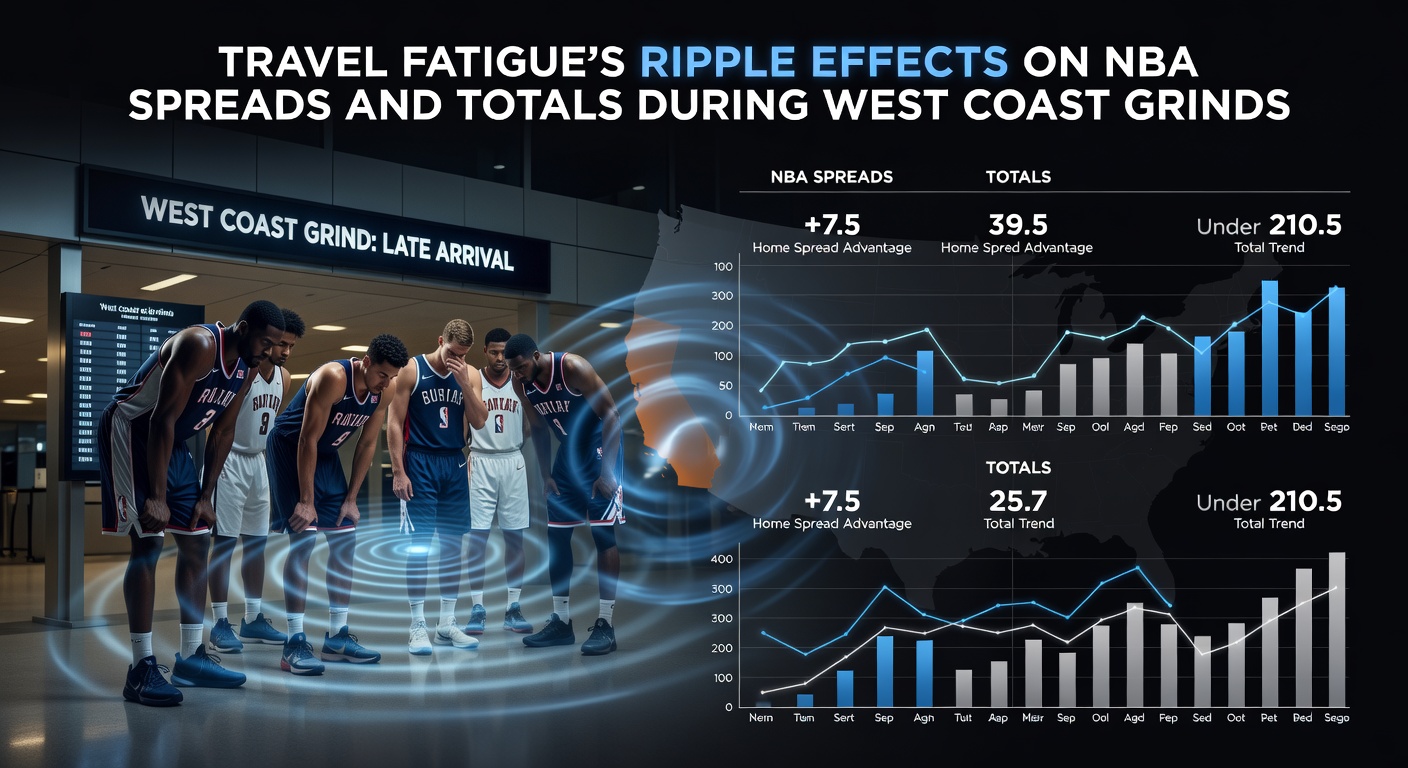
Betting lines adjust gradually as sportsbooks incorporate travel-related data, yet historical closing spreads still reflect underperformance by fatigued visitors. In games involving teams on the third leg of a West Coast set, the visiting side covered the spread in only 41 percent of instances during the 2024-25 campaign according to league-wide logs, while overs landed at a 47 percent clip when both clubs had crossed time zones within the prior seventy-two hours. Those figures emerge from comprehensive play-by-play repositories that isolate road-trip segments, and they hold after controlling for rest advantage and opponent strength. Totals compress because transition offense slows and half-court execution tightens under fatigue, producing fewer fast-break opportunities and lower three-point attempt volumes in the fourth quarter. Spread movement follows because market makers widen or narrow numbers based on sharp action that anticipates these efficiency drops rather than public perception alone.
Performance Metrics Affected by Accumulated Fatigue
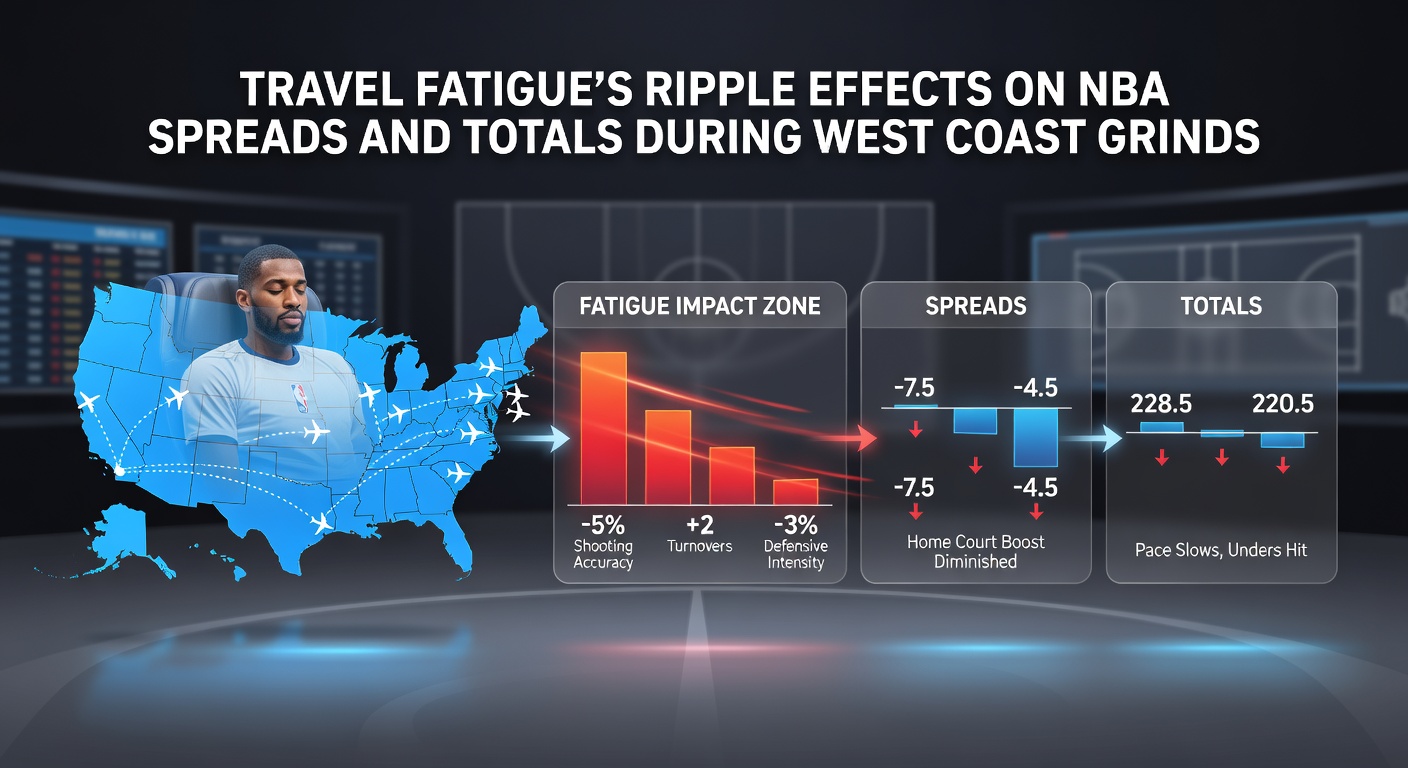
Player-tracking data reveals specific declines that feed into totals and spreads. Field-goal percentage on pull-up jumpers falls roughly 3.8 percentage points for squads completing coast-to-coast flights the day before tip-off, while defensive rating worsens by 2.9 points per 100 possessions on the second night of a back-to-back within the same trip. These changes appear across multiple rosters and persist even after accounting for injuries or load-management minutes, according to reports compiled by sports-science groups. Rebound rates on the defensive glass also dip when players log fewer than seven hours of sleep between games, a threshold crossed frequently during West Coast clusters because of flight schedules and arena start times. The combined effect reduces game pace and scoring bursts, which in turn pushes totals lower while creating value on the side favored by rest or home-court adjustment.
Examples from Recent Western Conference Clusters
During a late-April 2026 sequence, one Eastern Conference club posted its lowest offensive rating of the month across three consecutive games in California and Arizona, finishing 6.4 points per 100 possessions below its season mark. Sportsbooks responded by shifting the closing total downward by three points from the opener to the finale of that swing, and the under covered in two of the three contests. Similar patterns surfaced in May when a Central Division team traveled to three Pacific Northwest venues in eight days, with player-efficiency ratings dropping most sharply in the middle contest before rebounding slightly in the final stop. These movements illustrate how fatigue compounds across consecutive nights rather than appearing uniformly, and they align with earlier academic examinations of transcontinental travel in professional basketball.
Market Adjustments and Sharp Action
Line makers monitor airline manifests and injury reports to calibrate numbers ahead of tip-off, yet residual edges remain when public bettors overweight recent results without isolating travel context. Data from betting exchanges indicates that limits on totals tighten faster than spreads during peak West Coast periods, reflecting sharper recognition of pace suppression among professional bettors. A 2024 study published by a Canadian university sports-research center documented that visiting teams on multi-time-zone trips generate 2.7 fewer transition points per game than their season baseline, a figure that directly influences over/under modeling. Observers tracking line movement note that totals often open higher on the first game of a swing before drifting lower once early results confirm the efficiency decline, creating a window for bettors who review cumulative travel logs rather than standalone box scores.
Conclusion
Travel fatigue during West Coast grinds produces repeatable impacts on NBA spreads and totals that surface through aggregated performance data and line adjustments. Teams crossing multiple time zones exhibit measurable drops in shooting accuracy, defensive rebounding, and transition scoring, particularly on the second and third nights of extended road sets. These shifts appear consistently across seasons and receive incorporation into closing numbers, although timing differences between sharp action and public betting can still leave measurable edges. Continued collection of sleep and travel metrics will likely refine models further as the league maintains dense spring schedules that include such sequences.